
Describe Image in PTE Speaking- 7 Smart Working Tips & Techniques
PTE Speaking Describe Image: one of the most dreaded tasks amongst the 20 in the PTE Academic Test.
But, sitting and thinking that you might not be able to ace this task is not going to fetch anything.
A Wise person said,
Thinking Will Not Overcome Fear, But Action Will.
We want to help you conquer every fear when it comes to PTE Academic. As far as this task is concerned, we take the liberty to think that you might already be using various tips and expert strategies. What we will show you here is how can you exactly apply them and check the ones that work the best for you. Let us first list the tips one by one.
- You must be thoroughly aware of the Scoring Method and Criteria along with the knowledge of all the subskills.
- Keep a mental note of the time you have to speak. You must speak only the main ideas.
- Answering in a structured way will make the task a lot easier for you.
- Know the different types of images asked.
- Be aware of the different Vocab especially statistical vocabulary that you can use for charts, graphs, maps, diagrams, and so on.
- Learn to describe trends and use words emphasize on the important points of the image.
- It is not necessary to always use the same words as in the image. For example, you can mention the percentages using words like quarter, hale, nearly double and so on.
You Must Be Thoroughly Aware Of The Scoring Method & Criteria Along With The Knowledge Of All The Subskills That Are Tested.
While this task is essentially testing the speaking skills, the main 3 subskills that are tested here are Content, Pronunciation and Oral Fluency.
Therefore, you need to be logical with your explanation. It doesn't matter if you lack the native English accent. What is more crucial is that you ought to pronounce the words clearly. At the same time, note that long pauses as well as fillers are going to harm your score.
Moreover, do not be in hurry. Maintain a steady pace with voice modulations i.e stressing on the key words, taking appropriate pauses. Avoid a flat tone. For an image that has more information, be smart and spot the trend or the important points quickly and only describe that.
Smart Tips:
Use the Erasable Notepad. Quickly jot down the words that come to your mind or draw a narration of main points using short hand.
It is very important to understand the units of measure or the entity being measured and mention them properly while speaking.
Keep a Mental Note Of The Time You Have To Speak. You Must Speak Only The Main Ideas.
You can refer to the sample questions at PTE Tutorials, and get a fair idea of how you must speak in order to give an ideal answer. You have 25 seconds to study the image after which there will be a short tone which is an indication that you must start speaking. Make sure to start speaking immediately as you have only 40 seconds. Also, Do Not, again, DO NOT speak before the beep goes off else your response will not be recorded. There will be a progressing bar. Finish with your response before that bar reaches the end and turns to 'completed' status.
Okay! Now that you know about the format and took the feel of the question, the question remains: How should you Describe an Image? Is there any optimum or fixed way?
To be honest, there is a structure that you can fit in your subconscious and every time you see a question of this task, just maintain it.
It is simple. Remember, whenever you are talking on some topic what you essentially do is introduce the topic, speak the main ideas about it and finally conclude. We do this in daily life without realising. So next time, try to practice with full attention. All you got to do is Introduce-- describe main trends/ highlight main points-- Conclude.
Smart Tip:
You can use specific Vocab that indicates you are introducing or concluding or highlighting the main points.
Example,
The Line graph shows that……
The Bar Graph depicts……
Know The Different Types Of Images Asked.
Bar Graph || Line Graph || Pie Chart || Demographic chart || Organizational Chart || Venn diagram || Tables || Maps || Pictures || Flowcharts || Life Cycle || Others
These are the many types of images that can be asked in the Describe Image Task of PTE Speaking. Sometimes two of these types can also be combined and asked as a single question, where both will be related and you will have to provide your response likewise.
We will discuss each type of image asked in this task-type and the structure you can follow to describe them, the vocab as well as the styles for different scenarios in the coming blogs. It is not any short cut to get full score but surely a way to ease up the difficulty level of this task.

Be Aware Of The Different Vocab Especially Statistical Vocabulary That You Can Use For Charts, Graphs, Maps, Diagrams, And So On...
Out of the 6-7 images asked, you will definitely get images of graph or charts. Both these types generally show the statistics. Take care of the X & Y axis. Further, you must describe trends here. For instance,
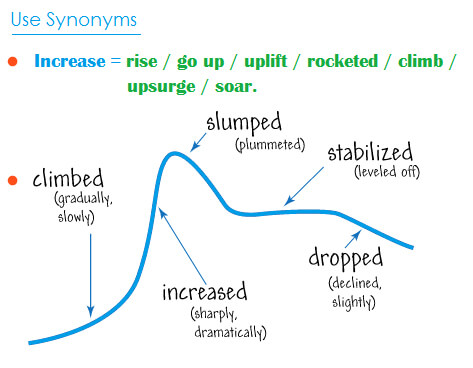
For pie charts, you can use the comparative and superlative vocab. Example, largest of all, least famous in the group, smaller than the other two. While describing tables you will definitely come across comparisons between two or sometimes even more than two entities. Also, there can be more than one type of comparison depending upon the amount of information in the question. If the image is of a map then you can make use of locations, directions (East, west, north, south) and even shapes. For coloured map, describe specific items using colours. For process, it is much simpler; you have to describe the process as per the flow.
Learn To Describe Trends And Use Words Emphasize On The Important Points Of The Image.
So we told you about describing trends. Let us have a look at how exactly would you do that.
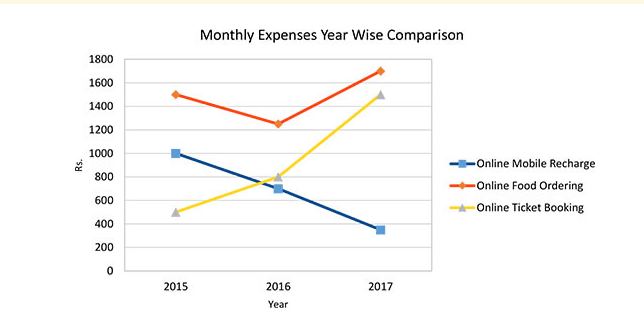
Take a close look at this graph. It gives the Monthly Expense Year Wise Comparison. There are 3 coloured lines- red, blue and yellow indicating Online Mobile Recharge, Online Food Ordering, and Online Ticket Booking. The X-axis mentions the year- 2015, 2016, 2017 and the Y-axis mentions the price in Rupees (Rs.).
You can see that the orange line going down from the year 2015 to 2016 and then going up from 2016 to 2017. So, this is a trend and you can use words like the yearly expenditure on Online Food Ordering dropped rapidly till 2016 after which it steadily increased in the year 2016-2017. Similarly, notice the blue line which is for Online mobile recharge. You can say, 'the monthly expense on Online Mobile Recharge constantly declined for the 3 years from 2015 and was less than 400 rupees in 2017'. And for the Yellow line, you can define the trend like this, from 2015-2016, the Online Ticket Booking Monthly Expenses increased gradually after which the expenses steeply increased.
It Is Not Necessary To Always Use The Same Words As In The Image.
For example, you can mention the percentages using words like quarter, hale, nearly double and so on.
What we mean to say here is that if you want to fetch marks for content, try to explain the main points using good vocab. When we say vocab, we do not mean fancy words. What we mean is there are different ways of saying the same things. Let us understand with the help of an example.
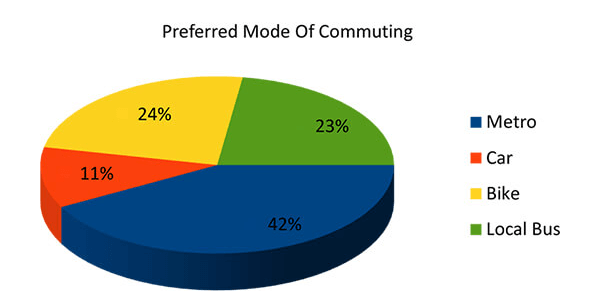
The given Pie chart gives the preferred mode of commuting for people. The four modes are Metro (blue), Car (orange), Bike (yellow), Local Bus (green). Upon carefully looking at the given pie chart you would notice that the percentage for metro is 42% and for bike and local bus combined is 24% + 23 % = 47%. Here, while describing you could say,
"As can be seen in the data of the pie chart, people mostly preferred to commute via the metro. While the percentage of people commuting via bike and local bus is almost similar i.e 24% and 23% respectively. It brings to our notice that the number of people travelling by a metro is same as the combined number travelling using bike and local bus which leaves a small portion of people, as many as 11 %, travelling by car."
The bottom line is that you need to speak with proper content, structure, in a fluent manner by pronouncing the words correctly. No need of an accent. PTE Assessor uses an ordinate technology and an intelligent system which has inputs of thousands of accents to interpret various words. Focus on the above points and ensure to implement the tips we have provided.
Hey! We know it is difficult to judge your own speaking. You might miss out on minute mistakes or do not understand how to rectify the repeated ones.
Make sure you practice with these tips every time and use the feedback you get from the services to improve your speaking response. All The Best...

Do share us your experience and feedback. And go read tips for other modules like reading and writing as well.