Learn This Simple Trick for Describe Image Task in PTE Academic!
Describe Image is one of the trickiest tasks of the PTE Academic Exam and the Speaking module. A test-taker is allowed about 25 seconds to study a given
image/graph, and prepare their response. After the time ends, the test-taker has 40 seconds to record his/her audio
response through the microphone, covering all the important points. Once the microphone is activated, the test-taker
will hear a tone. Following the tone, the test-taker should start speaking. As the recording starts, the progress
bar records the progress and the status changes from "recording" to "recording completed" once the recording is
over.
Before you know it, the task starts, and it's over. Extracting meaningful data in such a short amount of time can
prove to be a difficult task. Unless you are well-prepared with a proper strategy, it is very difficult to perform
well in the Describe Image task.
First, a word on the different types of images you may encounter in the task. Among
other different types of images, you may get:
- Bar graph
- Line graph
- Pie chart
- Organisation chart
- Venn diagram
- Tables
- Maps
- Flowchart diagrams
Now, one of the crucial things to be kept in mind in the Describe Image task is that one has to avoid pauses or
saying words like 'umm', 'aah' etc. To be well prepared, one can be ready with a set of pre-defined sentence
structure or template, which is flexible enough to be used in a lot of circumstances. While you may not end up using
such a template every time, but it is a good starting point, when you are unsure of how to begin speaking in the
task.
Here is a template that you can use, although you could create your own as per your convenience.
- For the introduction: "The given (chart type) shows/compares/describes/depicts/talks about…"
- For the main body: "A study of the (chart type) shows that…"
In this section, you have to tell the story that is being represented pictorially by the given image type. This is
the most important part of the task, and a lot depends on what information you are able to extract from the image by
studying it.
- For the conclusion: "In conclusion/Concluding, we can say…"
Here's how you can use the templates in different examples:
Example 1:

Sample answer:
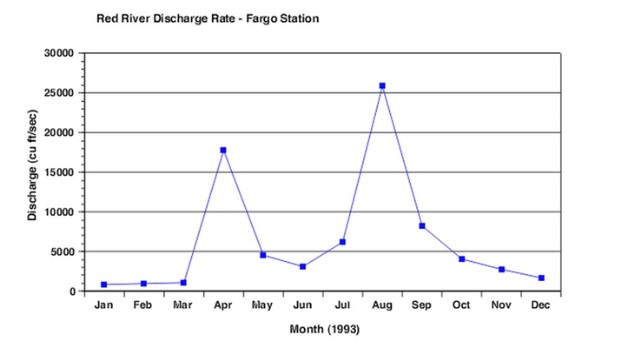
The given line graph shows the Red River Discharge Rate at Fargo Station throughout the year 1993, plotted
on a monthly basis. A study of the line graph shows that Red River Discharge Rate spiked in the months of
April and August, crossing 15,000 cu ft./sec and 25,000 cu ft./sec respectively. Otherwise, the rate has remained
under 10,000 cu ft./sec in the other months of the year 1993.
In conclusion, we can say that the line graph is very informative, and tells us about the Red River
Discharge Rate.
Example 2:

Sample answer:
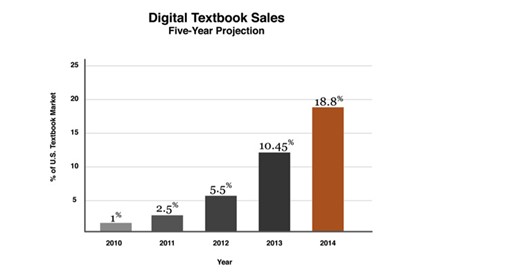
The given bar graph shows a five-year projection of digital textbook sales as a percentage of total sales in
the US textbook market. A study of the bar graph shows that the sales of digital textbooks is projected to
peak at 18.8% in the years 2014. From 2010-2014, digital textbook sales have shown an upward trend increase from 1%
in 2010 to 18.8% in 2014.
In conclusion, we can say that the bar graph is very informative, and tells us about the five-year
projection of digital textbook sales.
This method, if followed properly, can be used to answer every type of question in the Describe Image task. Even if
the image is complicated, and there are a lot of facts, test-takers should not get confused, and start with anything
that stands out. The key is fill the 40 seconds of recording, with uninterrupted description of the image, with a
proper introduction and a conclusion.
If you want to avail online coaching for PTE, do not hesitate to reach out to us. You can also avail our Writing Correction and Describe Image Correction services to improve your score, or to nail your desired score!